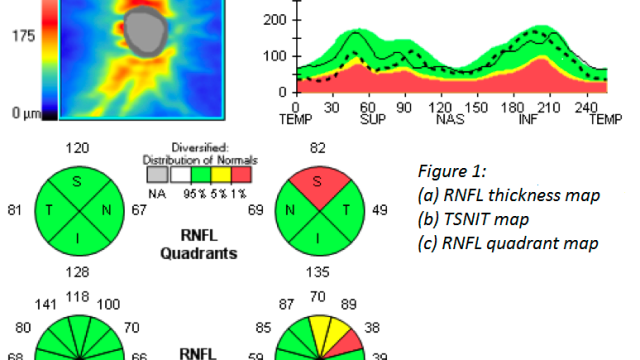
An OCT scan (Optical Coherence Tomography) is a non-invasive imaging test that shows detailed cross-sections of the retina and optic nerve. It helps detect early damage in conditions like glaucoma, often before vision loss is noticeable.
OCT Scan for Glaucoma: How Do You Read Your Report? The report is filled with colourful circles, numbers, and graphs. It tells us how your optic nerve and retinal nerve fibre layer compares with those of someone your age and ethnicity, who does not have glaucoma.
If you have glaucoma, or are being evaluated for it, you you must have been advised a RNFL OCT for glaucoma. Many patients leave the clinic wondering: Is this good? Is this bad? Is my disease getting worse?
Let’s slow this down and make the OCT RNFL scan understandable, writes Dr Bhartiya.
Dr Shibal Bhartiya is a fellowship-trained glaucoma specialist and Mayo Clinic Research Collaborator with over 25 years of experience. Her approach focuses on identifying risk before damage is irreversible, simplifying treatment decisions, and protecting vision long-term. Emphasis on early detection, risk assessment, and continuity of care. She is rated 5 stars across 1,500+ patient reviews on Google.
What Is an OCT RNFL Scan?
OCT (Optical Coherence Tomography) is a non-invasive imaging test that uses light waves to create detailed cross-sectional images of the retina and optic nerve.
RNFL stands for Retinal Nerve Fibre Layer—the layer made up of the nerve fibres that carry visual information from the eye to the brain. In glaucoma, these nerve fibres are gradually lost. The OCT RNFL scan helps us measure and monitor that loss over time.
Why Is RNFL OCT Important in Glaucoma?
Glaucoma is a disease of the optic nerve.
The RNFL is essentially the wiring of that nerve.
- Thinning of the RNFL often precedes vision loss
- RNFL damage can occur before you notice symptoms
- Monitoring RNFL helps detect early disease and progression
This is why OCT has become such a central part of glaucoma care.
Understanding the Colours on Your RNFL OCT Glaucoma Report
Most OCT reports use colour coding:
- Green – Within expected range for age
- Yellow – Borderline or suspicious
- Red – Thinner than expected
But this is where confusion begins.
Important to know:
- Colour does not equal diagnosis
- Red does not always mean worsening
- Green does not guarantee safety
These colours are statistical comparisons, not clinical conclusions.
Common Reasons RNFL OCT Glaucoma Results Can Be Misleading
An OCT RNFL scan must always be interpreted in context.
Some common pitfalls include:
1. Normal Anatomical Variation
Some people naturally have thinner or thicker RNFLs.
2. High Myopia (Near-sightedness)
Myopic eyes often show artificially thin RNFL measurements.
3. Signal Quality Issues
Dry eyes, blinking, cataract, or poor fixation can distort results.
4. Age-Related Changes
RNFL thickness slowly reduces with age, even without glaucoma.
This is why one scan alone rarely tells the full story. In glaucoma, this loss is exaggerated, that is, more than expected by age alone.
RNFL vs Optic Nerve Head: Why Both Matter
Patients often ask: “Why do I need so many tests?”
Because each test answers a different question.
- RNFL OCT looks at nerve fibre thickness
- Optic nerve head (ONH) imaging looks at structural shape and cupping
- Visual fields measure functional vision loss
Glaucoma progression is diagnosed by patterns over time, not by a single number.
Does a Change in RNFL Always Mean Progression?
No, and this is crucial.
Small fluctuations between scans are common and may reflect:
- Measurement variability
- Scan alignment differences
- Physiological changes due to aging
True progression is identified by:
- Consistent change over multiple scans
- Correlation with clinical findings
- Matching visual field trends
This is why experienced interpretation matters far more than software alerts.
OCT in Normal-Pressure and Early Glaucoma
In normal-tension glaucoma and early disease:
- RNFL damage may be subtle
- Progression may be slow
- Structural change can occur before pressure rises
Here, OCT helps guide risk stratification, not panic decisions.
What OCT Cannot Tell You
An OCT RNFL scan cannot:
- Predict exactly when vision loss will occur
- Replace a full clinical examination
- Decide treatment in isolation
It is a tool, not a verdict.
The Bigger Picture: What Are We Really Trying to Preserve?
In glaucoma care, the goal is not perfect scans.
It is quality of vision and quality of life over decades.
This means:
- Detecting meaningful change early
- Avoiding unnecessary treatment escalation
- Protecting function, not chasing numbers
When I review an OCT, I rarely look at the colour map first. I first ask whether the scan quality is reliable, whether the anatomy makes sense, and whether it matches the optic nerve and visual field. Only then do I interpret the numbers.
When Should You Seek a Second Opinion?
A structured second opinion may help if:
- You are told your OCT is “worsening” without explanation
- Different doctors interpret the same scan differently
- Treatment decisions are being made based on a single test
A good second opinion integrates OCT, clinical findings, visual fields, and long-term risk, not just colour codes.
One of the most common reasons patients seek a second opinion with me is that an OCT report has been interpreted without considering the optic nerve, visual field, corneal thickness, or the patient’s overall risk profile.
What Is the RNFL Thickness Normal Range on OCT?
This is the question patients ask most. There is no single magic number. Normal RNFL thickness varies with age, race, and the OCT machine used. As a general guide, average global RNFL thickness of 90–110 microns is considered normal in adults. Values below 80 microns often appear in the red zone on most OCT machines. Values between 80–90 microns fall in the yellow or borderline zone.
But here is what matters more than any single number. Your RNFL thickness normal range on OCT must be compared against a matched normative database. Age reduces RNFL thickness by roughly 0.5 microns per year, even without glaucoma. A 70-year-old patient with an RNFL of 82 microns may be entirely normal. A 35-year-old with the same reading may warrant closer review.
Regional RNFL values matter as much as global averages. Glaucoma tends to thin the inferior and superior sectors first. An inferior RNFL below 100 microns in a young patient deserves attention, even when the global average looks reassuring.
Always ask your doctor: “Is this normal for my age, eye shape, and history?” — not just “Is this red or green?”
Optic Nerve OCT Scan: What Does It Actually Show?
An OCT scan for glaucoma does not stop at the RNFL. Optic nerve OCT scan interpretation is a separate but equally important part of glaucoma assessment.
The optic nerve head (ONH) analysis on OCT measures the rim area, disc area, rim-to-disc ratio, and the shape of the optic cup. These structural parameters tell us how much healthy nerve tissue remains at the disc itself.
Three parameters matter most in optic nerve OCT scan interpretation.
Rim area refers to the remaining healthy neural tissue around the optic cup. Thinning of the rim, especially at the inferior and superior poles, is an early sign of glaucoma damage.
Cup volume tells us how much of the central disc has lost neural tissue. An expanding cup is a red flag.
BMO-MRW (Bruch’s Membrane Opening Minimum Rim Width) is a newer, more accurate measure of the neuroretinal rim. It is more sensitive to early damage than older rim measurements.
Optic nerve OCT scan interpretation must always combine these structural measures with the clinical appearance of the disc. OCT gives numbers; the ophthalmologist gives meaning.
What Is the GCC or Macular OCT in Glaucoma?
Many patients receive a macular OCT report alongside their RNFL scan. The macular OCT in glaucoma focuses on the Ganglion Cell Complex (GCC) or Ganglion Cell-Inner Plexiform Layer (GCIPL), the retinal layers where the nerve cell bodies sit.
OCT ganglion cell complex analysis in glaucoma is particularly useful because the macula contains a very high density of retinal ganglion cells. Even a small amount of glaucoma damage here can reduce GCC macular OCT values measurably.
GCC macular OCT glaucoma analysis offers two specific advantages. First, it detects early glaucoma damage in patients with small optic discs, where RNFL analysis is less reliable. Second, it helps track progression in advanced glaucoma, when the RNFL is already so thin that further thinning is harder to detect, a phenomenon called the floor effect.
A focal GCC loss, particularly in the inferotemporal macular region, often corresponds to an early visual field defect. This is why an OCT scan for glaucoma now routinely includes GCC or macular analysis alongside RNFL.
If your report shows a GCC thickness map with focal yellow or red areas, ask your doctor where on the visual field that area corresponds to. The two should match. If they do not, the finding needs careful review.
Cup to Disc Ratio and Glaucoma: What Does It Mean?
The cup to disc ratio (CDR) is one of the oldest measures in glaucoma. It compares the size of the central cup (the hollow area) to the total size of the optic disc. A normal cup to disc ratio is generally 0.3–0.5. Values above 0.6 raise suspicion for glaucoma in many patients.
But the cup to disc ratio in glaucoma must be interpreted carefully. A large CDR alone does not confirm glaucoma. Large physiological cups are common and entirely benign. What matters is whether the cup is expanding over time, whether the rim tissue is thinning asymmetrically, and whether CDR correlates with RNFL thinning and visual field changes.
OCT now measures the cup to disc ratio with greater precision than clinical examination alone. It also detects asymmetry between the two eyes: a CDR difference of more than 0.2 between fellow eyes is a significant clinical concern, even when both values appear individually normal.
When patients ask me about their cup to disc ratio, I tell them this: the number is a starting point, not a conclusion. What we are watching is the trajectory, not the snapshot.
How to Read Your OCT Scan for Glaucoma: A Summary
An OCT scan for glaucoma gives you several layers of information. Here is how to approach your report.
RNFL analysis — Look at the global average and the inferior/superior sectors. Note the colour coding, but always ask your doctor to contextualise it for your age and eye type.
Optic nerve head analysis — Check rim area and cup volume. Asymmetry between the two eyes often matters more than absolute values.
GCC/macular analysis — Look for focal areas of thinning, particularly in the inferior macular region.
Progression analysis — If you have serial scans, the trend line matters most. A stable red zone is reassuring. A previously green zone turning yellow over three scans warrants attention.
No single OCT scan for glaucoma gives a complete clinical picture. The value lies in the pattern — across time, across tests, and in the hands of someone who can interpret it.
Known for her structured approach to glaucoma risk assessment and progression analysis, Dr Shibal Bhartiya provides trusted second opinions for patients seeking clarity before major treatment decisions. Both, in person, and online.
Frequently Asked Questions: OCT Scan for Glaucoma
Why is my OCT red if I don’t have glaucoma?
A red area on an OCT report does not automatically mean you have glaucoma. OCT software compares your retinal nerve fibre layer with a built-in reference database. High myopia, naturally large or small optic nerves, scan artefacts, poor image quality, or normal anatomical variation can all produce “red” results in healthy eyes. An experienced glaucoma specialist interprets the colour map alongside your optic nerve examination, visual field test, eye pressure, corneal thickness, and overall risk profile before making a diagnosis.
Can OCT miss glaucoma?
Yes. Although OCT is one of the most valuable tests for glaucoma, it is not perfect. Very early glaucoma may not produce measurable structural changes, while advanced glaucoma may reach a “floor effect,” where further damage is difficult to detect. OCT results can also be affected by scan quality, high myopia, cataract, or anatomical variations. This is why glaucoma diagnosis and monitoring should never rely on OCT alone.
Can glaucoma exist with a normal OCT?
Yes. A normal OCT does not completely exclude glaucoma. Some people have early functional loss on visual field testing before structural thinning becomes apparent on OCT. Others may have suspicious optic nerve changes or significant risk factors despite normal imaging. When glaucoma is suspected, OCT is interpreted together with the optic nerve examination, visual field testing, eye pressure measurements, and your individual clinical history.
Why does my OCT change every year?
Small differences between OCT scans are common and do not always indicate worsening glaucoma. Scan alignment, image quality, natural biological variation, ageing, and differences in machine calibration can all influence measurements. Your ophthalmologist looks for consistent patterns of change over multiple visits rather than reacting to a single scan. True glaucoma progression is determined by combining OCT trends with visual field testing and clinical examination.
How accurate is OCT in highly myopic eyes?
OCT is extremely useful in highly myopic eyes, but interpretation requires additional caution. Myopia can alter the shape of the optic nerve and retina, leading to false-positive results or measurements that fall outside the normal reference database despite the absence of glaucoma. Rather than relying solely on the colour map, a glaucoma specialist considers scan quality, retinal anatomy, optic nerve appearance, visual fields, and changes over time to distinguish myopia-related findings from true glaucoma.
What is a normal RNFL thickness on OCT?
Average global RNFL thickness of 90–110 microns is generally considered normal in adults. Values below 80 microns often appear in the red zone. Normal ranges vary with age, so always interpret your result in the context of your age, eye type, and clinical history.
What does a red zone on the RNFL OCT mean?
A red zone means your RNFL thickness is thinner than expected for your age group based on a normative database. It does not automatically mean you have glaucoma or that your disease is worsening. Myopia, scan quality issues, and natural anatomical variation can all produce red zones. Your doctor must interpret the finding in full clinical context.
What is the GCC or macular OCT in glaucoma?
The GCC (Ganglion Cell Complex) or GCIPL macular OCT measures the nerve cell body layer in the macula. It helps detect early glaucoma damage, particularly in patients with small optic discs or advanced disease where RNFL measurements become less reliable.
What is a normal cup to disc ratio?
A cup to disc ratio of 0.3–0.5 is generally considered normal. Values above 0.6 raise concern in many patients. However, large physiological cups are common and benign. A CDR difference of more than 0.2 between the two eyes, or a cup that is expanding over time, is more clinically significant than the absolute number.
How often should I get an OCT scan for glaucoma?
Most glaucoma specialists recommend an OCT scan every 6–12 months, depending on disease severity and risk of progression. Stable patients with early disease may scan annually. Patients with faster progression or recent treatment changes may need scans every 4–6 months.
Can an OCT scan detect glaucoma before vision loss?
Yes. RNFL and GCC thinning on OCT can precede detectable visual field loss by months to years. This is one of the primary reasons OCT has become essential to early glaucoma detection and monitoring.
What should I bring to my OCT scan appointment?
Bring all previous OCT reports, visual field tests, and prescription records. Serial comparison is how glaucoma progression is tracked. A single scan in isolation provides limited information.
Gentle Takeaway
If your OCT report feels confusing, that does not mean your disease is severe.
It often means the data needs careful interpretation.
Glaucoma management is a long game—measured, thoughtful, and individualised.
Book a consultation with Dr Shibal Bhartiya:
Marengo Asia Hospitals, Gurugram
Phone: +91 88826 38735 | Website: drshibalbhartiya.com
Google Business Profile: maps.app.goo.gl/mcfegmHTuhqV5hSp6
This page is a part of the Glaucoma Hub. you may want to read about Glaucoma Progression, and Risk Stratification in Glaucoma. You may want to read more about OCT and Visual Field, Glaucoma Tests Explained, Normal OCT but Vision Symptoms and How to Understand Your OCT Better. Also of help could be Why Do I Need a Visual Field Test? Glaucoma Diagnosis in Gurgaon, Get a GlaucomaSecond Opinion in Gurgaon and Get an Online Glaucoma Consult.
Read some of Dr Shibal Bhartiya’s research on OCT
A Meta-analysis of the Effect of Panretinal Photocoagulation on Retinal Nerve Fibre Layer Thickness
This meta-analysis evaluated how panretinal laser treatment affects retinal nerve fibre layer thickness on OCT, helping clinicians interpret OCT changes accurately after diabetic retinopathy treatment.
Comparative Evaluation of Time-Domain and Spectral-Domain OCT
This study compared two generations of OCT technology for retinal nerve fibre layer measurements, highlighting the importance of using consistent imaging when monitoring glaucoma patients over time.
Long-term Effect of Panretinal Photocoagulation on RNFL Parameters
This research examined the long-term impact of panretinal laser treatment on OCT measurements, improving our understanding of retinal nerve fibre layer changes following treatment for proliferative diabetic retinopathy.
Assessment of RNFL Changes by Cirrus HD-OCT in Myopia
This study investigated how myopia influences retinal nerve fibre layer measurements on OCT, emphasising the need to interpret scans carefully in highly myopic eyes to avoid misdiagnosis.
About the Author
This article was written by Dr Shibal Bhartiya, fellowship-trained glaucoma specialist and Mayo Clinic Research Collaborator, Clinical Director at Marengo Asia Hospitals, Gurugram, known for ethical, patient-centred glaucoma care and independent glaucoma second opinions. She is also the Program Director for Community Outreach & Wellness; and for the Marengo Asia International Institute of Neuro and Spine.
She has published peer-reviewed research on glaucoma management, examining how treatment decisions should balance medical evidence, patient preferences, and long-term vision outcomes.
As Editor-in-Chief of Clinical and Experimental Vision and Eye Research and Executive Editor of the Journal of Current Glaucoma Practice (Pubmed Indexed, official journal of the International Society of Glaucoma Surgery), Dr Shibal Bhartiya brings editorial and research depth to every clinical decision. Her 200+ publications, including 90+ PubMed-indexed publications and 28 edited textbooks span glaucoma biology, surgical outcomes, health equity, and emerging diagnostics.
1600+ Five Star Patient Reviews Google Business Profile
If you are unable to come to Dr Bhartiya’s clinic: Read more about teleconsultation
Read her research on PubMed | Google Scholar | ResearchGate | ORCID
Upload your reports for a structured review.| www.drshibalbhartiya.com | +91 88826 38735
Leave a review on Google