Quick Answer
A visual field test maps your side and central vision. In glaucoma, the trend across several reliable tests matters far more than any one printout.
You have the printout in your hand. It is full of numbers, grey squares and little symbols, and no one explained it. That is very common. The report was built for doctors, so almost nobody understands it on first sight.
A visual field test, also called perimetry, measures what you can see without moving your eyes. You look at a central target and press a button each time a faint light appears in your side vision. Most tests take about 4 to 8 minutes per eye, depending on the machine. Read more in What Happens During a Visual Field Test?
Dr Shibal Bhartiya is a fellowship-trained glaucoma specialist and Mayo Clinic Research Collaborator with over 25 years of experience. Her approach focuses on identifying risk before damage is irreversible, simplifying treatment decisions, and protecting vision long-term. She is rated 5 stars across 1,600+ patient reviews on Google.
Why Does Glaucoma Need a Visual Field Test?
Glaucoma damages the optic nerve quietly. Most people do not notice lost side vision until a lot of it has gone. The visual field test picks up that loss of function, often years before you would.
An OCT scan answers a different question. OCT asks whether the nerve fibre layer is thinning. The field test asks whether that thinning has changed what you see. You can have clear thinning on OCT with a normal field. You can also have a field defect before the OCT looks obviously abnormal. That is why glaucoma care needs both. Read more in OCT and Visual Field.
The Numbers on Your Visual Field Printout
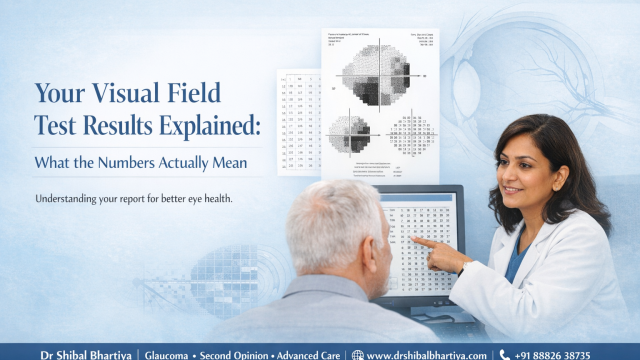
Different machines name things slightly differently. The ideas below come from the Humphrey printout, and Octopus and MRF reports carry the same core information. Check the reliability numbers first, then read the rest.
| Part of the report | What it tells you | What to look for |
|---|---|---|
| Reliability indices | Whether the test can be trusted | Fixation losses above 20%, false positives above 15%, false negatives above 33% |
| Mean Deviation (MD) | How far your overall field sits from a person your age without glaucoma | The number, and whether it is changing across visits |
| Pattern Standard Deviation (PSD) | How patchy the loss is | A high value suggests focal loss |
| Visual Field Index (VFI) | Overall field as a percentage of normal | A falling trend over time |
| Glaucoma Hemifield Test (GHT) | Whether the upper and lower halves differ | “Outside Normal Limits” is a strong signal |
| Total and Pattern Deviation plots | Where each point sits against normal | Clusters of dark symbols in the Pattern Deviation plot |
| Grey scale | A picture of your field | Use it for orientation only |
Start With Reliability
An unreliable test can mimic glaucoma or hide real change. Three numbers tell you how far to trust the rest.
- Fixation losses count how often your gaze left the central target. Above 20% the result may be inaccurate.
- False positives count button presses when no light appeared. Above 15% the field looks better than it is.
- False negatives count missed lights in areas you had already seen. Above 33% can mean tiredness, inattention or advanced disease.
A poor score is not a failure on your part. Most people perform better on the second and third test. Your doctor will usually repeat the test before acting.
Mean Deviation (MD)
MD is the single most useful number on the page. It is measured in decibels (dB) and compares your whole field with that of a person your age who does not have glaucoma.
- 0 to −2 dB: normal range
- −2 to −6 dB: mild loss
- −6 to −12 dB: moderate loss
- Worse than −12 dB: severe loss
A p-value sits beside the number. A p-value below 5% means fewer than 5 in 100 people without glaucoma would score this low. Below 0.5% is a strong sign of real change. A person with an MD of −4 dB is not necessarily in trouble. A steady −4 is very different from a −4 that was −2 six months ago.
Pattern Standard Deviation (PSD)
MD tells you how much overall sensitivity is missing. PSD tells you the shape of the loss. Glaucoma tends to eat into vision in patches, so a high PSD with a modest MD suggests early, focal damage. A low PSD with a poor MD points the other way: an even, overall dip. Cataract, a small pupil or a tired test often cause that.
Visual Field Index (VFI)
VFI turns your field into a percentage. 100% is a full field and 0% is none. It is less affected by cataract than MD, so doctors use it to track change over the years.
Glaucoma Hemifield Test (GHT)
The GHT compares the top and bottom halves of your field. Glaucoma often harms one half before the other, so asymmetry matters. The report prints one of five messages:
- Within Normal Limits: no meaningful difference between the halves
- Borderline: mild difference, worth watching
- Outside Normal Limits: a clear difference, clinically important
- General Reduction of Sensitivity: an even dip, often a test quality problem
- Abnormally High Sensitivity: rare, usually a test artefact
Outside Normal Limits does not confirm glaucoma. It tells your doctor to look closer.
The Plots and the Grey Scale
The grey scale is the picture most patients look at first, and it misleads the most. The machine fills the gaps between tested points, so a small defect can look large. Use it for orientation only.
The Total Deviation plot compares each point with normal for your age. The Pattern Deviation plot removes the effect of an overall dip, such as from cataract, and shows only local defects. A cluster of dark symbols there, especially in the arcs above or below the centre, is the classic mark of glaucoma.
What Does Field Loss Due To Glaucoma Look Like?
Doctors look for a few shapes on the map.
- Nasal step: a sharp difference between the upper and lower field on the nose side. Often an early sign.
- Arcuate defect: a curved band of loss that follows the nerve fibre paths above or below the centre. The classic glaucoma pattern.
- Paracentral defect: small patches near the centre. Seen early in some types, including normal tension glaucoma.
- Advanced loss: only a central or temporal island of vision remains.
Glaucoma damage usually follows the horizontal line through the middle of the field. A defect with a straight edge down the vertical midline points elsewhere. Read more in Can a Visual Field Test Show a Problem in My Brain?
Why One Visual Field is Not Enough
A single test is a snapshot. Glaucoma decisions come from the trend across several reliable tests, which is why your doctor asks for repeats. Three to five reliable tests are needed before a trend means much.
How fast the field is changing matters as much as how much has been lost. A drop of about 1 dB a year or more is generally treated as fast. A slow drift can be very different, even when the two printouts look alike on the day. This is why I plot your numbers over time and do not judge a single page. Read more in Glaucoma Progression.
How often you need a test depends on your risk. Twice a year is typical. In the first two years after diagnosis, after a change in treatment, or when your doctor suspects progression, you may need more.
What Doctors Often Miss Telling You
- A worse result after a normal one needs confirming before anything changes. Fatigue, poor fixation, a cold or a bad night’s sleep can all lower a score.
- Cataract lowers the whole field. If a cataract has grown since your last test, tell your doctor. It can look like glaucoma getting worse.
- Missing lights is part of the design. The machine shows lights near your threshold on purpose. Read more in How Do I Do Well on a Visual Field Test?
- Comparing your MD with a friend’s tells you nothing. Optic nerves, ages and rates of change differ. Your own trend is what counts.
- The machine does not diagnose glaucoma. It flags differences from normal. Your doctor puts them in context with your pressure, optic nerve and OCT.
Questions to Ask After Your Test
- What is my MD, and has it changed since my last test?
- Was this test reliable enough to act on?
- Does the Pattern Deviation plot show a focal defect?
- What is my rate of change?
- Does my field match what my OCT shows?
- When should I repeat the test?
When to See a Doctor
See a Doctor Urgently
Go to an emergency department the same day if you have:
- Sudden loss of vision in one eye
- A sudden new dark area or curtain across your vision
- Severe eye pain with redness, halos around lights, headache or vomiting
See a Doctor
Book a visit soon if:
- Your field is worse on a repeat test
- You are bumping into things on one side, or missing objects at the edge of your vision
- A report has not been explained to you
- Your treatment is being stepped up on the strength of a single test
- Your field and OCT disagree, or your field is worsening while your OCT has stayed steady
What This Means for You
A visual field report is not a verdict. It is one point in a long conversation between you, your doctor and your eyes. If the numbers feel overwhelming, ask to see the trend line, not just today’s page. Bring every old report to each visit, so your doctor can compare like with like.
Frequently Asked Questions
Can I fail a visual field test?
No. The test measures what is there. The reliability numbers show whether the result can be trusted. If you were tired or nervous, your doctor will simply repeat it.
My field was normal last year and abnormal now. Is my glaucoma worse?
Possibly, but one abnormal result after a normal one needs confirming. Your doctor will usually repeat the test before changing treatment.
What is a good mean deviation for glaucoma?
A reading between 0 and −2 dB is in the normal range. What matters more is whether your number is stable. A steady −4 dB is very different from a −4 that has fallen from −2.
Does cataract affect my visual field?
Yes. Cataract lowers the whole field and can make glaucoma look worse than it is. The Pattern Deviation plot partly corrects for it. Tell your doctor if your cataract has grown.
Can a visual field improve in glaucoma?
Lost nerve fibres do not grow back. A later score can look better when an earlier test was affected by tiredness or the learning effect. That is another reason a series of tests tells you more than one.
My friend’s MD is −3 dB and mine is −5 dB. Is my glaucoma worse?
Not necessarily. Ages, optic nerves and rates of change differ, so two people cannot be compared this way. Your own trend matters.
Is the visual field test available in Gurgaon?
Yes. Dr Bhartiya runs visual field testing at her glaucoma clinic at Marengo Asia Hospitals, Gurugram. Read more in Visual Field Test (Perimetry) in Gurgaon.
Get Your Visual Field Reviewed by Dr Bhartiya
Were you told your field is worsening, but your symptoms have not changed? Did two doctors read the same printout differently? Bring all your visual fields and OCT reports. Dr Bhartiya reviews the full history together, explains the trend and tells you what, if anything, needs to change.
Not sure what to bring? Read What to Bring for Your Visit, or Upload your reports for a structured review
Book an Appointment:
📍 Gurgaon 📞 +91 88826 38735 | 🌐 Contact Us | Second Opinion Form for teleconsults
This page is part of the Glaucoma Hub. You may want to read about Glaucoma Progression and Risk Stratification in Glaucoma. More on visual fields: Why Do I Need a Visual Field Test?, How Do I Do Well on a Visual Field Test? and Glaucoma Test Results Explained: OCT, Visual Fields and Eye Pressure. Other articles of interest could be Advanced Glaucoma Care in Gurgaon, What Happens If Glaucoma Is Left Untreated? and Do You Really Need Treatment for Glaucoma?
To know more about visual fields, read What to Expect and What the Results Mean, How To Do Visual Fields, Glaucoma Test Results Explained: OCT, Visual Fields and Eye Pressure, Why Do I Need a Visual Field, and Neurological Visual Fields.
About the Author
This article was written by Dr Shibal Bhartiya, fellowship-trained glaucoma specialist and Mayo Clinic Research Collaborator, Clinical Director at Marengo Asia Hospitals, Gurugram, known for ethical, patient-centred glaucoma care and independent glaucoma second opinions. She is also the Program Director for Community Outreach & Wellness; and for the Marengo Asia International Institute of Neuro and Spine.
Dr Bhartiya has published peer-reviewed research onglaucoma management, examining how treatment decisions should balance medical evidence, patient preferences, and long-term vision outcomes. She is also a committed patient advocate and mainstream medical columnist, translating complex ophthalmic evidence into actionable public health insights across leading national platforms including NDTV and OnlyMyHealth
As Editor-in-Chief of Clinical and Experimental Vision and Eye Research and Executive Editor of the Journal of Current Glaucoma Practice (Pubmed Indexed, official journal of the International Society of Glaucoma Surgery). Her 200+ publications, including 90+ PubMed-indexed publications and 28 edited textbooks span glaucoma biology, surgical outcomes, health equity, and emerging diagnostics.
1600+ Five Star Patient Reviews Google Business Profile
If you are unable to come to Dr Bhartiya’s clinic: Read more about teleconsultation
Read her research on PubMed | Google Scholar | ResearchGate | ORCID | Github | Wikidata
📋Upload your reports for a structured review.| 🌐 Contact Us| 📞 +91 88826 38735
⭐ Helped by this article? Leave a Google review — it helps other patients find reliable eye care.
Last Reviewed: October 2026